Google's ATLAS v1.0: 15 Million Interactions Show AI Adoption Is a Mile Wide and an Inch Deep
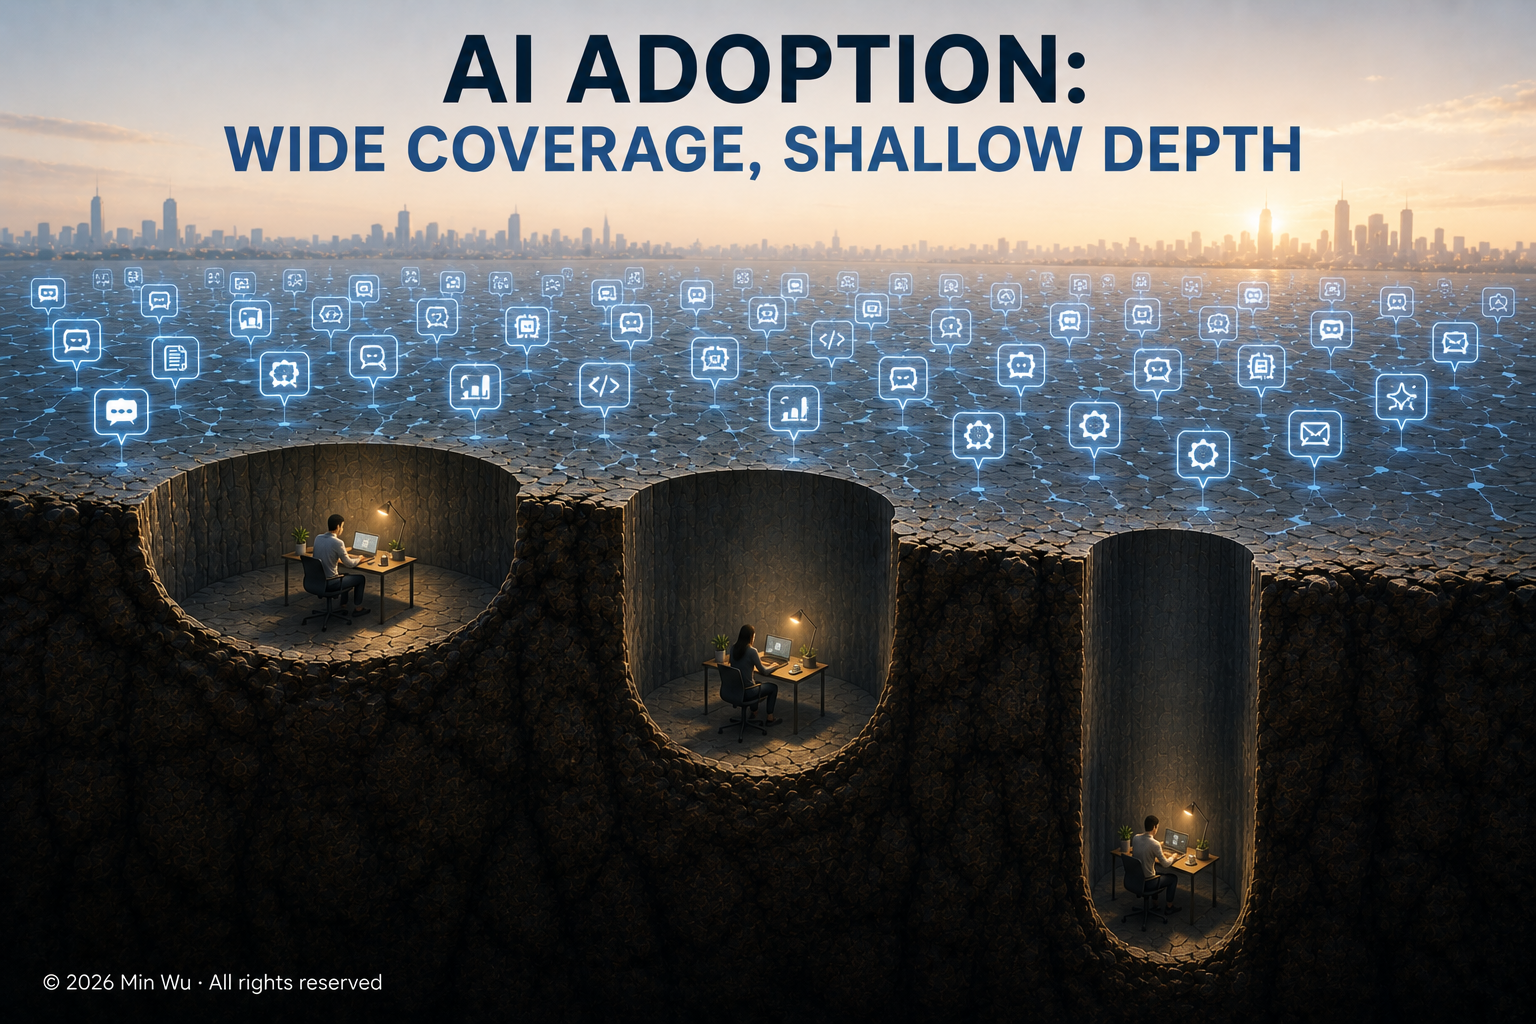
ATLAS v1.0's real lesson is not simply that AI adoption should go deeper. It is that adoption counts are becoming the wrong denominator: enterprises should measure where AI appears at the task level, how deeply it penetrates workflows, whether it assists or executes, and whether the resulting work actually improves.
📊 What ATLAS Actually Measured
Google’s ATLAS v1.0 — the Activity, Task, Landscape, and Adoption Study — analyzes roughly 15 million de-identified interactions across the Gemini App, Google AI Mode, and the Gemini API.
The dataset covers 14,653,926 interactions sampled between April 6 and April 19, 2026, spanning more than 800 occupations, roughly 4,000 work tasks, 300 household activities, 150 countries, and 140 languages.
ATLAS is powered by Google DeepMind’s Observation Clustering and Taxonomy Organisation (OCTO), which transforms unstructured AI conversations into structured activities and maps work-related interactions to O*NET occupational and task taxonomies — also used by Anthropic’s Economic Index.
That shared taxonomy creates an unusually useful cross-vendor comparison point. But there is an important boundary around what ATLAS actually measures.
Fifteen million interactions are not fifteen million workers, and observed AI activity is not the same thing as productivity, adoption, or task completion.
ATLAS tells us where AI is showing up in a very large sample of real-world interactions. It does not tell us whether the resulting work was successful.
🌊 The Headline Finding: Broad but Shallow
The most important number in ATLAS is not 15 million.
It is 21%.
Observed AI usage spans roughly 68% of detailed occupations, representing 88.4% of US employment. Yet among occupations where ATLAS observes meaningful AI activity, the median occupation shows usage across only about 21% of its constituent tasks.
Only around 3% of occupations show observed AI activity across more than three-quarters of their tasks.
AI has broad occupational reach without equivalent workflow depth.
And where AI does appear, it is not predominantly replacing entire tasks.
Usage clusters around Partial Drafting and Generation, Review and Refinement, Ideation and Strategy, and Information Retrieval and Learning.
For non-routine cognitive work — which accounts for roughly 65% of observed work-related interactions despite representing only around 35% of professional tasks — end-to-end automation intent represents less than 10% of conversations.
But that headline hides an important boundary.
The <10% automation figure is not economy-wide. ATLAS’s classification shows end-to-end automation intent at roughly 27% for routine cognitive interactions, compared with about 6.5% for non-routine cognitive work.
Codifiable, rules-based cognitive activities are already showing materially more automation intent than complex non-routine work.
ATLAS therefore describes something more nuanced than either “AI is automating jobs” or “AI is merely assisting workers.”
The execution mode changes with the structure of the task.
🔀 Google and Anthropic Are Seeing the Same Shape
Anthropic’s Economic Index provides the closest large-scale comparison, although the numbers should not be treated as directly interchangeable.
| Dimension | Google ATLAS v1.0 | Anthropic Economic Index |
|---|---|---|
| Sample size | ~14.7M interactions | >4M conversations in early reports |
| Occupational breadth | ~68% show meaningful observed use | 36% showed use across ≥25% of tasks in original study |
| Task depth | Median covered occupation: ~21% | 49% reach ≥25% when observations are pooled across reports |
| Automation signal | <10% end-to-end automation intent in non-routine cognitive interactions | 43% automation classification in original Claude.ai study |
| Scope | Gemini App, AI Mode, API | Claude.ai + first-party API |
Anthropic originally found that 36% of occupations saw Claude used across at least a quarter of their tasks. Pooling observations across subsequent Economic Index reports raises that figure to 49%.
But Google’s <10% automation figure and Anthropic’s 43% should not be interpreted as evidence that Gemini is less automation-oriented than Claude. The studies use different automation taxonomies, interfaces, populations, and denominators.
Anthropic’s own research shows how much the interface matters. Its later Economic Index work finds substantially higher automation rates in first-party API usage than in Claude.ai, while agentic environments such as Claude Code have also shown much higher automation classifications than ordinary conversational use.
The convergence is not in the exact numbers. It is in the shape of adoption: wide across the economy, uneven and much thinner within individual workflows.
Both datasets also share the same fundamental limitation: they observe interactions, not the ultimate productive outcome.
🎯 The Wrong Denominator
Most enterprise AI dashboards still measure adoption through numbers such as licenses deployed, monthly active users, prompt volume, or percentage of employees using AI.
Those metrics answer:
How many people are using AI?
ATLAS suggests that this is increasingly the wrong question.
A company could have AI in the hands of 80% of its employees while AI touches only a handful of activities in each person’s workflow. Another could have lower employee adoption but deep integration across the core tasks of several critical business functions.
The first organization might look more advanced on a conventional adoption dashboard while the second is undergoing the larger operational transformation.
A more useful measurement stack looks like this:
               AI Adoption
                    │
         Occupational Breadth
                    │
             Task Penetration
                    │
             Execution Mode
            Assist ↔ Automate
                    │
             Realized Outcome
The unit of AI adoption is increasingly the task, not the user.
That distinction matters simultaneously for ROI, workforce planning, and AI governance.
💰 Why This Matters for ROI
Only 46% of AI initiatives launched in the prior year were assessed as on track to achieve positive ROI within 12 months, while 37% were considered operational and delivering business value.
ATLAS does not prove why those initiatives struggle. But it provides one structural explanation for why enterprise value may diffuse more slowly than headline adoption suggests.
If AI reaches many employees but touches only selected parts of their workflows, economic impact depends on much more than the number of users.
It depends on which tasks AI touches, how important those tasks are, how much time they consume, and whether AI actually improves their execution.
A 21% task-penetration rate does not imply a 21% productivity impact.
Automating one critical bottleneck could generate more value than assisting ten peripheral activities.
Depth matters, but task value matters more.
That is why enterprise AI measurement ultimately has to connect usage traces to business outcomes rather than stopping at adoption statistics.
👥 What It Says — and Doesn’t Say — About Jobs
ATLAS suggests higher-wage workers may automate routine cognitive activities while collaborating with AI on more complex non-routine work — a pattern Google notes could contribute to deeper wage inequality.
The immediate workforce signal is therefore not wholesale occupational displacement, but uneven task transformation.
Some activities are delegated. Others are augmented. Many remain largely untouched.
But today’s shallow penetration should not be confused with a technological ceiling.
ATLAS is a two-week snapshot of usage in April 2026. More embedded and agentic interfaces can produce very different behavior, as Anthropic’s API and Claude Code data already suggest.
As AI moves from answering questions to operating tools, navigating software, and executing multi-step workflows, the task boundary itself can move.
ATLAS describes today’s adoption frontier, not the ultimate automation frontier.
That distinction belongs in any workforce-risk model built from these numbers.
🕳️ The Missing Enterprise Layer
There is another reason not to treat 21% as a universal benchmark.
ATLAS excludes Google Workspace, Google Translate, AI Overviews, Gemini for Google Cloud, and Gemini Enterprise.
That means it does not observe a major class of embedded enterprise workflows — precisely the environments where AI can sit directly inside documents, software development, analytics, customer operations, and business processes.
Those environments could exhibit materially different task penetration and automation patterns.
Anthropic’s interface-level findings reinforce why this matters: AI behavior changes substantially depending on whether the model sits behind a conversational interface, an API, or an agentic tool.
Where AI is embedded may matter almost as much as which model is being used.
ATLAS is therefore best understood as a behavioral baseline for the surfaces it observes — not a universal measurement of AI penetration across the enterprise economy.
🔬 The Bigger Measurement Lesson
OCTO itself may ultimately be as interesting as the headline statistics.
Google’s infrastructure is not directly replicable by most enterprises. But the measurement architecture is.
Instead of counting AI licenses or asking employees whether they use AI, organizations can increasingly analyze behavioral traces:
Interaction Logs
       ↓
Business Tasks
       ↓
Workflow Penetration
       ↓
Augmentation / Automation
       ↓
Business Outcomes
That connects directly to the measurement problem I discussed in Agent Benchmark Scores Are Lying to You.
ATLAS analyzes interaction traces rather than agent execution traces, so the two are not technically identical. But the underlying idea is the same:
Behavioral traces are becoming a more useful unit of evidence than aggregate benchmark scores or adoption counts.
For agentic systems, that measurement layer can extend beyond conversations into tool calls, intermediate actions, retries, permissions, state transitions, and environmental effects.
That creates the possibility of a unified enterprise measurement architecture connecting AI adoption, AI governance, and AI evaluation through the same underlying evidence.
🎯 The Takeaway
ATLAS does not show that AI will not automate jobs.
It does not prove that shallow adoption explains disappointing enterprise ROI.
And it certainly does not establish that today’s task penetration represents a ceiling.
What it does provide is one of the strongest large-scale behavioral baselines yet available for understanding how AI is actually entering work.
The picture is remarkably consistent:
AI diffusion is occurring task by task, unevenly inside occupations, and predominantly through collaboration rather than end-to-end delegation — at least for now.
That makes “How many employees use AI?” increasingly inadequate as a measure of transformation.
The better questions are:
Which tasks? How deeply? In what execution mode? And with what outcome?